Here is this week's report from researcher Barbara Buckley:
I began the first detailed perusal of the data logs this week with the goal
of developing a protocol for systematically analyzing them. The basic approach
is to read and summarize the logs of one student at a time in order to develop
a sense of that student's path through BioLogica, what challenges and questions
were difficult or easy and how engaged the student seemed to be. The objective
is to identify and characterize variables we can use to compare the use of BioLogica
across students and to quantify relevant aspects of their use.
I am using the data set generated when 24 students used BioLogica during our
3 day intensive field test for several reasons:
- nearly all of the students made it through all of the BioLogica activities,
- any learning gains can be attributed to this 3 day experience over which
we had (some) control, and
- there was no control group in this implementation so we gain most through
a detailed understanding of the learning of individual students when they
had access to BioLogica.
811 log files were generated of which 649 can be analyzed. The remaining 162
were empty due to aborted launches and other causes. In order to choose which
logs to examine, I imported the scores from the pre- and post-tests into a spreadsheet
and generated a plot of the post-test scores against the pre-test scores (See
Figure 2.)
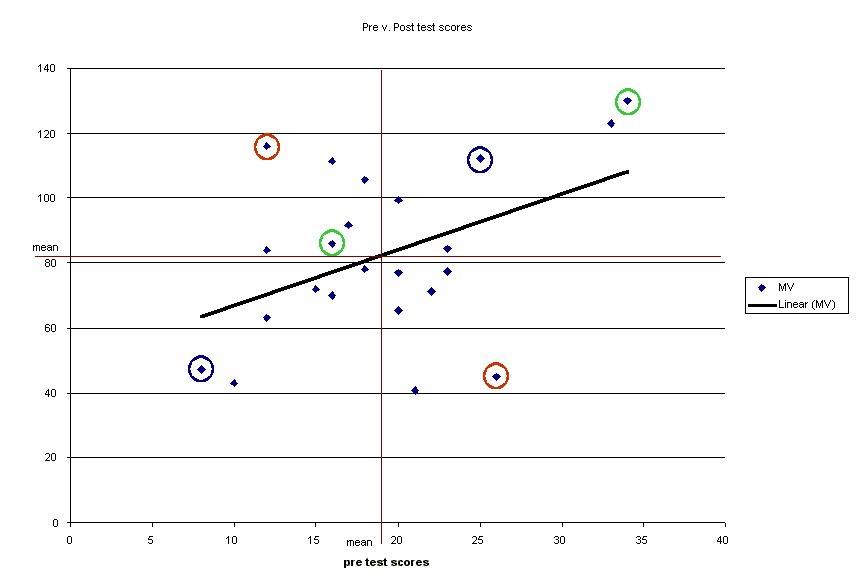
Figure 2. Post-test scores as a function of pre-test scores. Please note that
these are raw test scores, not percentages. Each point represents one student
and is located at the intersection of the student's pre-test score (on the x
axis) and post-test score (on the y axis). Notice the two points near the top
right of the plot. These are students who scored well on the pre-test, suggesting
prior genetics knowledge. In contrast, the two points in the lower left are
students who demonstrated little prior genetics knowledge and didn't do terribly
well on the post-test. Two other points (circled in red) are of particular interest.
They represent students in the other two quadrants - one who came in with little
prior knowledge and scored well on the post-test, and one who came in with moderate
prior knowledge and scored poorly on the post-test. The points circled in green
represent log files analyzed. The points circled in blue or red remain to be
analyzed.
Based on a first analysis of the logs of two students, I suggest the following
variables may be salient:
- Proportion of EQs answered (PEQ)
- Proportion of multiple choice questions (MCQs) answered correctly (PMCQ)
- Attempts per challenge (APC): How many attempts they make before solving
a challenge
- Total Time in activity (TTA)
- Time per challenge (TPC): The length of time it takes to solve a challenge
- Time per text screen (TPTS): The length of time each text screen is being
displayed
Unfortunately the only way to gather such data at the moment is labor-intensive
coding by humans. The data logs currently generated have not been designed with
such variables in mind. Hence, another goal of analyzing the data logs is to
generate design specs that better support both data collection and data analysis.
As I read the data logs, I also generate observations about what and how the
student is learning or not learning. For example, one student with the highest
pre-test score also had the highest post-test score; not too surprising. In
analyzing the logs I found that the student breezed through the Introduction
activity in 42 minutes, not spending much time on the text screens, and answered
most of the questions correctly and well (e.g., "I think that genotype
and phenotype are related because the genes and chromosomes of the genotype
influence the physical appearance or the phenotype of the dragon."). But
then the student wanted to know "What are genotype and phenotype exactly?"
Similarly, in working through the Rules activity on dominant, recessive, and
incompletely dominant traits, the student was able to choose the correct possible
allele combinations for each dragon presented, and enter reasonable answers
to the essay questions, but again wanted to know: "… what exacly an
incompletely dominant trait is." Answers to the essay questions in the
Rules activity revealed misconceptions about sex-linked traits. "Sex-linked
traits are only available to one sex, autosomal traits are available to both
sexes." "Fire breathing is a recessive trait because it is a sex-linked
trait" The first real challenges for this learner arose during the Meiosis
activity when it took 22 attempts to make the baby dragons required by the 5
challenges. We cannot say from the logs whether the student was having difficulty
with the new representation of the chromosomes and alleles in the Meiosis view
or whether the student was missing the conception that male dragons have XY
chromosomes and female dragons have XX chromosomes. The logs from the activities
previously encountered by this student give conflicting evidence. Logs from
the Introductory activity suggest that the student did know, but logs from the
Rules activity suggest that the student did not. Logs from later activities
suggest that the student had mastered both the representation and manipulation
of chromosomes and alleles in the Meiosis view and could select among the XX
and XY chromosomes to create babies of the desired sex.
After the data logs of a few more students have been analyzed, I will create
a table of the variables gleaned from them. From this data reduction and representation,
additional questions will no doubt arise which will require revisiting the data
logs and refining our variables and coding schemes.